Estimated reading time: 8 minutes
Note: this is a bi-weekly post that updates on the sales within the Guelph real estate market which you can bookmark. You can find a video version on our YouTube Channel here or listen to our Podcast version on Apple Podcasts or Spotify. If you like this information, give us a subscribe!
Guelph real estate sale summary for May 2026
The largest volume sales month in Guelph real estate is upon us! Historically, more transactions come together in May than any other month. There is usually more of everything in May: more buyers buying and more sellers selling. But, if you follow along on this blog series, you’ll know that 2026 has trailed 2025 in every month so far this year. Is it the same for May?
well, is it?
Believe it or not folks, for the first time in 2026 we are trending ahead of 2025 for sales. Barely, but we are.
Let’s start off with a re-cap the number of homes on average that have sold per day in prior Mays in Guelph real estate in order to get a baseline:
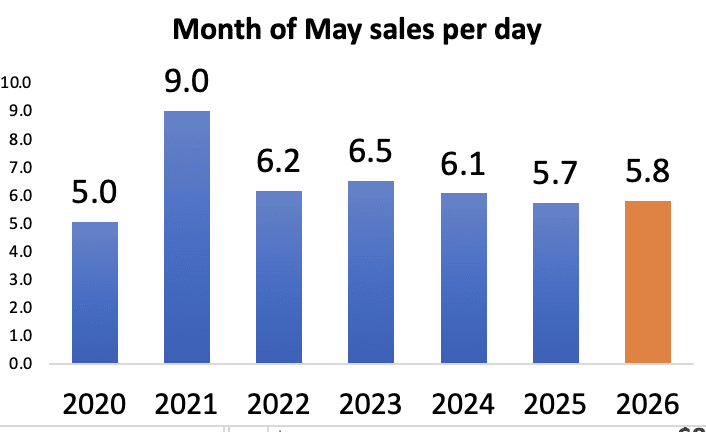
Yes, we’re barely ahead of 2025. But it’s worth noting because we’ve been struggling for all of 2026 to gain any momentum in the market. It appears, that perhaps buyers are emerging from their spring slumber.
But, do increased sales result in increased prices? Not necessarily.
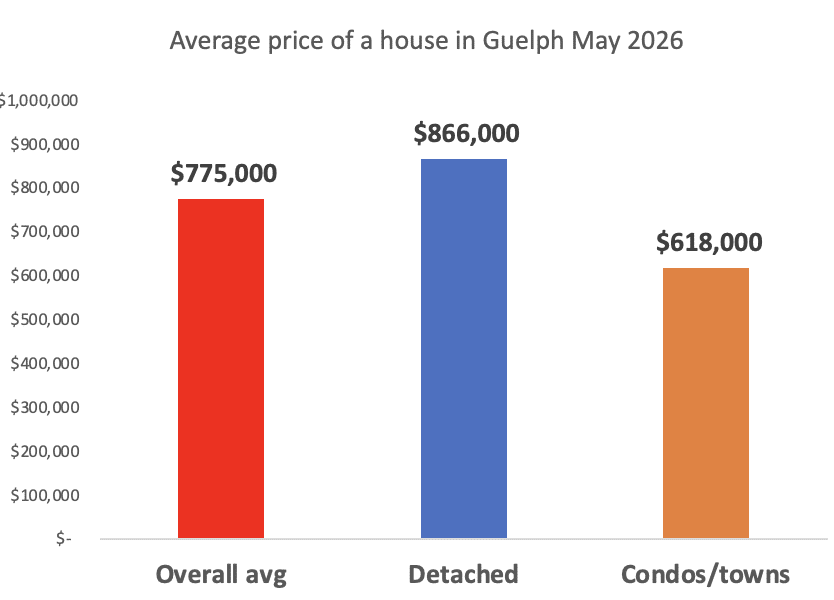
What was the average price of a house in Guelph May 2026?
The overall average price of a house declined through April, but has made a big jump up so far in May in both the detached and condo/ town segments (see below for greater detail on these segments)
This total consists of an average price of $618,000 for condos/ townhouses (32 sales) and $866,000 in detached homes (55 sales). Combined, the total average price so far in May is $775,000.
So what can we predict for further into the spring?
Traditionally, sellers who are struggling to sell in the months of November or December decide to cancel their listing and re-list in the spring. For many years, there was a pretty good chance that you could get a better outcome by doing this. However, 2026 hasn’t worked out that way so far.
In our 2026 Guelph real estate predictions video, we predicted that:
- unit volume (the number of houses sold) would increase 3-5%
- average price would decline 1-3%
But why?
Real estate is an open market and traditional supply and demand is in play. If there is little supply and lots of buyers (early 2022), prices rise. If there is a lot of supply and fewer buyers (now), prices decline. This is because buyers have more choice and can compare and negotiate accordingly.
First: on unit sales, we believe that the key months of May, June, September and October will outpace 2025. Since these months have higher than average volume, it will make up the sins of the other, slower volume months and finish at +3-5% vs 2025
Second, on average price: more available homes on the market, combined with a slowing economy and mortgage renewals will cause buyers to be more hesitant because they have more options. We’re not calling for a crash, but more homes at the lower end of sales prices will bring the average price down.
Is Guelph real estate inventory rising or falling overall?
There are currently 566 houses on the market in Guelph, up 5% in two weeks. However, all of that is in the detached segment, whereas the condo/ town segment has actually seen a decrease in active listings.
286 detached (a 10% increase in two weeks)
283 condo/ towns (a small decrease in two weeks)
This is extremely noteworthy because it’s a big change from what we’ve been talking about for months: stagnant detached and rising condo/ towns. We’re experiencing the opposite at the moment.
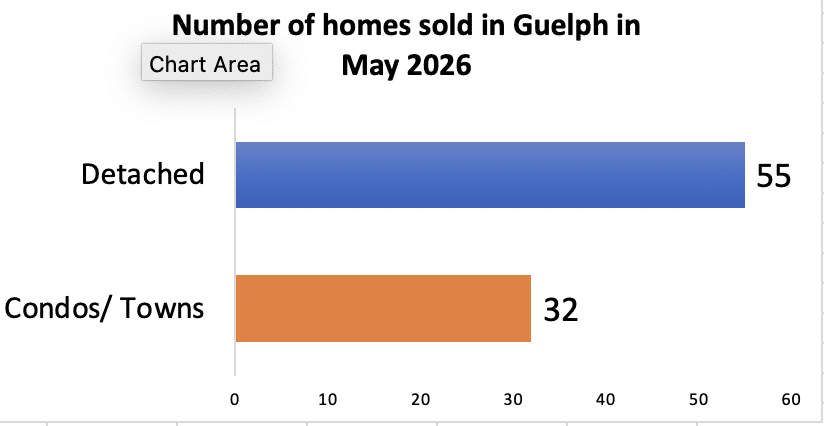
What sold in the Guelph real estate market so far in May 2026?
So far in May 2026 sa, made up of :
Condos/ townhouses/ stacked townhouses:
Of the 32 units that sold:
$320,000 was the low price (Onward Willow neighbourhood)
$1,285,000 was the high price (Clairfields neighbourhood)
As mentioned, a big change here in the past two weeks as the condo segment seems to have come alive in two ways:
- Average price has been in the low-mid $500,000’s for 6-8 months. So far in May it’s $618,000
- Sales per day: average 1- 1.3/ day for months. So far in May it’s over 2 per day.
Total homes sold at an average of 97.4% of the last posted asking. This means on average there is ~2% negotiation room from the last listed price. This has become a little more competitive over the few weeks as we’ve seen sales uptick:
3 of the 32 units sold over asking (9%)
6 of the 32 sold at the asking (19%)
23 sold under the asking (72%)
Is now a good time to buy or sell a condo in Guelph?
Well it appears the market thinks so. We continue to keep a close eye on this segment, in particular with the race to the exits of the condo market in Toronto. Guelph loosely follows Toronto trends and the market there very slow.
What we’re surprised to see is that despite being in the largest volume sales month, the condo inventory hasn’t increased at all. Are all the sellers that wanted to sell, on the market?
We’ll be watching this new trend, as it’s either an anomoly or perhaps a trend change.
Detached/ semi detached freehold
Of the 55 units that sold:
$545,000 was the low price (Onward Willow)
$1,460,000 was the high price (Downtown)
As mentioned earlier, the overall average was $875,000, the higher end point of what we’ve seen over the past year (between $800- $900K mark)
Total homes sold at an average of 99% of the last listed asking price- nothing notable.
12 of the 55 sold over asking (22%)
7 sold at the asking (13%)
36 sold under the asking (65%)
This is a slightly different breakdown than condos, where 10%+ are still selling over the asking, whether by design (“holding offers”) or pure demand.
Is now a good time to buy or sell a detached home in Guelph?
The demand for detached homes will always be greater than the condo segment. However, in Guelph we’re noticing that although inventory is rising, there are buyers there to buy it.
Consider this: In the eyes of a first time buyer, what’s a better financial decision: a detached home that doesn’t have monthly fees for $700K, or a $600K condo with $500/month fees? Of course, there is no right or wrong answer here, it depends on what is important to you. However, these are the decisions a buyer is considering in todays market.
What type of market is the Guelph real estate market in?
Guelph is currently in a balanced market trending towards a buyers market. The type of market we are in, is calculated on the trending months of inventory (MOI).
With 539 houses on the market and the last 3 months avg sales (122/mth), we have 4.1 months of inventory (MOI) which is putting us firmly in balanced real estate market territory.
However, we anticipate we will be inching closer to 6 MOI as the year moves on. This prediction is based on current lower volume sales trends along with increasing inventory with a spring market. Rising inventory = lower prices which buyers can benefit from.
Types of markets
Less than 2 MOI: sellers market. This means that prices will likely RISE because there is more demand (buyers buying) than supply (sellers selling)
2- 6 MOI: balanced market. This means there is enough inventory to satisfy needs of buyers and sellers and regular/ standard negotiations happen. We are currently here
6+ MOI: buyers market. This means there is more supply (houses for sale) than the demand for them (buyers to buy them). In this case, prices typically DECLINE because buyers can negotiate more
Year to date performance (Jan 1- Apr 30 2026) vs the same period 2025
We only update this monthly and we now have 4 full months of finalized data. Here is how the Guelph real estate market stack up this year vs last:
Number of houses sold: -12% (441 in 2026 vs 506 in 2025, 65 less houses)
$ volume sold: -17% ($328M in 2026 vs $397M in 2025)
Average price: -5% ($744K in 2026 vs $785K in 2025)
Want more info?
If you’re thinking of buying or selling, working with award winning Guelph real estate agents can make navigating this market much easier! Check out our other market update formats include video and podcast: