Estimated reading time: 7 minutes
Note: this is a bi-weekly post that updates on the sales within the Guelph real estate market which you can bookmark. You can find a video version on our YouTube Channel here or listen to our Podcast version on Apple Podcasts or Spotify. If you like this information, give us a subscribe!
Guelph real estate sale summary for mid March 2026
It feels like things are happening. This is conversation that we’re having with other real estate agents and clients. And, of course you’d expect that moving into the early spring market- March- would mean that sales would pick up. Right?
And it may be true- there may be more people out looking, or more sellers selling. But the numbers show that sales volume so far through mid March is actually slightly slower than February.
Let’s start off with a re-cap the number of homes on average that have sold per day in prior Marchs in Guelph real estate in order to get a baseline:
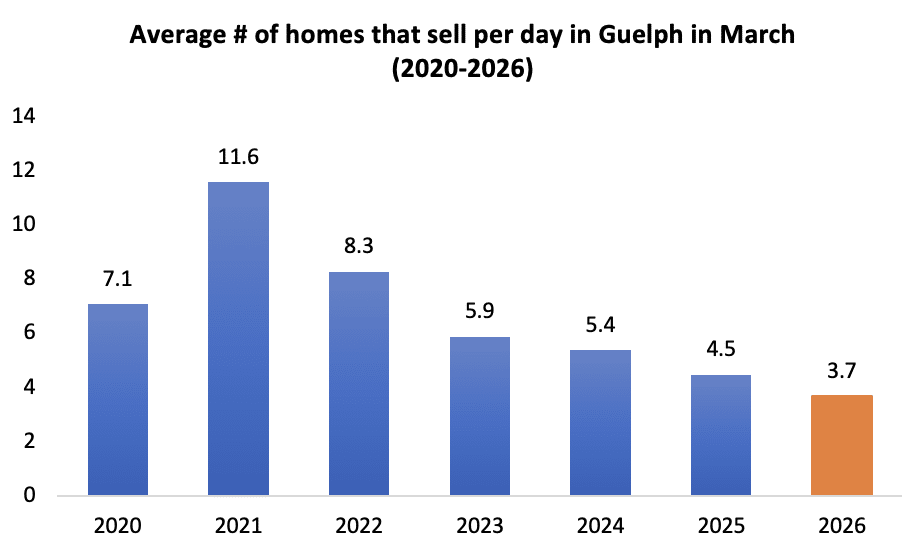
In fact, not only is March the slowest start to a March we’ve had in years, it’s actually moving at a slower pace than February.
It’s now the 3rd consecutive month of multi-year low volumes for a given month. How long will this continue and why is it happening? One theory is the extremely cold and long winter just has buyers sidelined, but personally we think that’s only one of about 5 factors. We’ll get into a few of them here, but be sure to watch Ryan’s video or podcast for more detail.
What was the average price of a house in Guelph in mid March 2026?
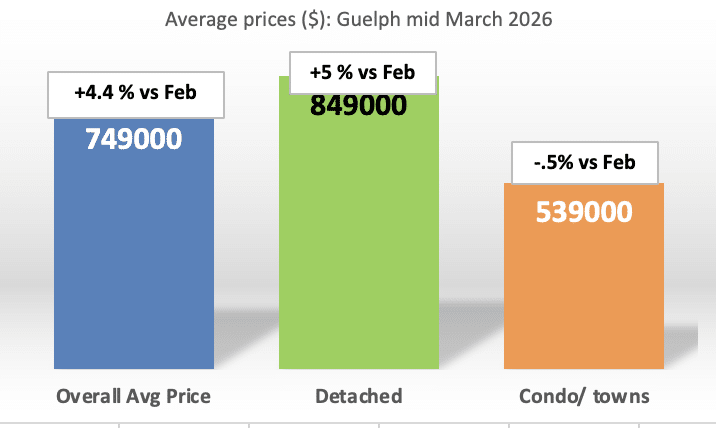
The overall average price of a house in Guelph in February 2026 was just over $749,000. This consists of an average price of $539,000 for condos/ townhouses (18 sales) and $849,000 in detached homes (38 sales).
The average price in February was $717,000, so we are seeing a rise here. However, the rise in average price is solely from the detached home segment
Is Guelph real estate inventory rising or falling overall?
Inventory was rising steadily into December, then started to decline which is typical. What we expected to happen is that much of the cancellations would return in January- but that didn’t happen.
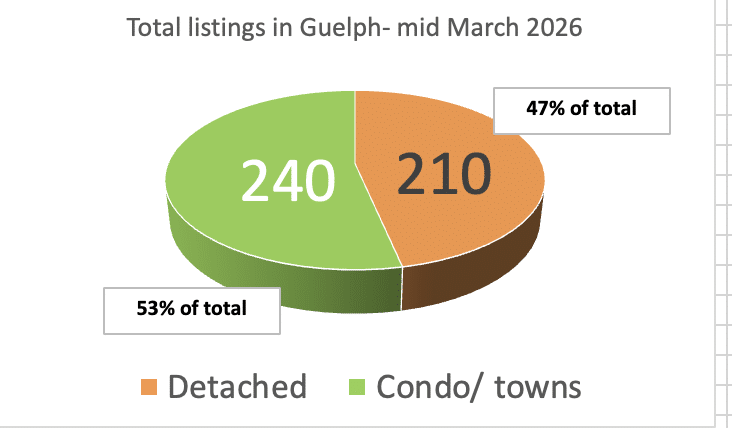
Only now, in mid March did we surpass the inventory levels from December 1, 2025. There are currently 450 houses on the market in Guelph, made up of 210 detached and 240 condo/ towns.
Over the past two weeks we have realized quite a rise in inventory, with a 5% rise in detached and 10% rise in condos/ towns
What’s sold in the Guelph real estate market so far in March 2026?
- 18 were condo/ townhouse/ stacked townhouse (properties with fees)
- 38 were detached and semi detached (properties without fees or “freehold”)
- 56 total residential properties
Condos/ townhouses/ stacked townhouses:
Of the 18 units that sold:
$360,000 was the low price (Onward Willow condo)
$900,000 was the high price (Pineridge)
As mentioned, the overall average was $539,000- a move into the middle of the trend for the past 6 months and almost flat to Feb. That being said, at this point we still anticipate the average price of a condo in Guelph will go lower in 2026.
Total homes sold at an average of 96.8% of the last posted asking, which continues the break below the 97% we’ve been trending towards. This would imply that there is more negotation happening that we’ve seen previously.
0 of the 18 units sold over asking (0%)
1 of the 18 sold at the asking (6%)
17 sold under the asking (94%)
A change in the condo/ townhouse segment?
We continue to keep a close eye on this segment, in particular with the race to the exits of the condo market in Toronto. Guelph loosely follows Toronto trends and the market there very slow.
For the 2nd month, we’re seeing increased sales here, along with increasing inventory. We are now sitting at roughly 8 months inventory in this segment, putting Guelph firmly in a buyers market for condos/ towns. However, we are consistently now selling over 1 per day (it’s been less than one/ day for months) with 1.3 selling/ day in Feb and March now at 1.2. Perhaps we see an early changing trend?
Additionally, we watch for vacant listings in this segment to get an idea of what owners are thinking. We currently have 42% of available condo listings vacant- as in, no one lives there but someone is paying the mortgage, condo fees, utilities and taxes. The thinking is that the carrying costs (monthly costs) are less than what they can sell for in the future vs now. This is an increase of 5% vs Feb.
Detached/ semi detached freehold
Of the 38 units that sold:
$492,000 was the low price (downtown)
$1,500,000 was the high price (Kortright Hills)
As mentioned earlier, the overall average was $849,000 (4% increase vs Feb)
Total homes sold at an average of 96.8% of the last listed asking price- this is a move down indicating more negotiation is happening.
2 of the 36 sold over asking (6%)
5 sold at the asking (14%)
29 sold under the asking (80%)
$1M plus segment
We watch this segment for an indication on trends. Historically, we see 15-20% of sales in the $1M+ price segment, but in the last few months this segment has been struggling. October ended at 17%, November at 7% and December 13%. January was back in the range at 16%.
February finished at 10.5% with sales in all parts of Guelph- east, west, south and downtown. In our opinion, we’re beginning to see this historical 15-20% move into the range of 10-15%.
March continues this trend as we see only 7% of homes sell over $1M. We’ll see what the full month brings.
What type of market is the Guelph real estate market in?
Guelph is currently in a balanced market trending towards a buyers market. The type of market we are in, is calculated on the trending months of inventory (MOI).
With 450 houses on the market and the last 3 months avg sales (88/mth), we have 5.1 months of inventory (MOI). Buyers are quickly gaining control.
We anticipate we will be above 6 MOI by May. This prediction is based on current lower volume sales trends along with increasing inventory with a spring market. Rising inventory = lower prices which buyers can benefit from.
Types of markets
Less than 2 MOI: sellers market. This means that prices will likely RISE because there is more demand (buyers buying) than supply (sellers selling)
2- 6 MOI: balanced market. This means there is enough inventory to satisfy needs of buyers and sellers and regular/ standard negotiations happen
6+ MOI: buyers market. This means there is more supply (houses for sale) than the demand for them (buyers to buy them). In this case, prices typically DECLINE because buyers can negotiate more
Year to date performance (Jan 1- Feb 28 2026 vs the same period 2025)
We only update this monthly, so we now have 2 full months of finalized data (January/ February). Here is how the real estate market stack up this year vs last:
Number of houses sold: -16% (180 in 2026 vs 215 in 2025)
$ volume sold: -23% ($131M in 2026 vs $169M in 2025)
Average price: -7.5% ($727K in 2026 vs $786K in 2025)
Want more info?
If you’re thinking of buying or selling, working with award winning Guelph real estate agents can make navigating this market much easier.